Animated Data Table with Spotify Data
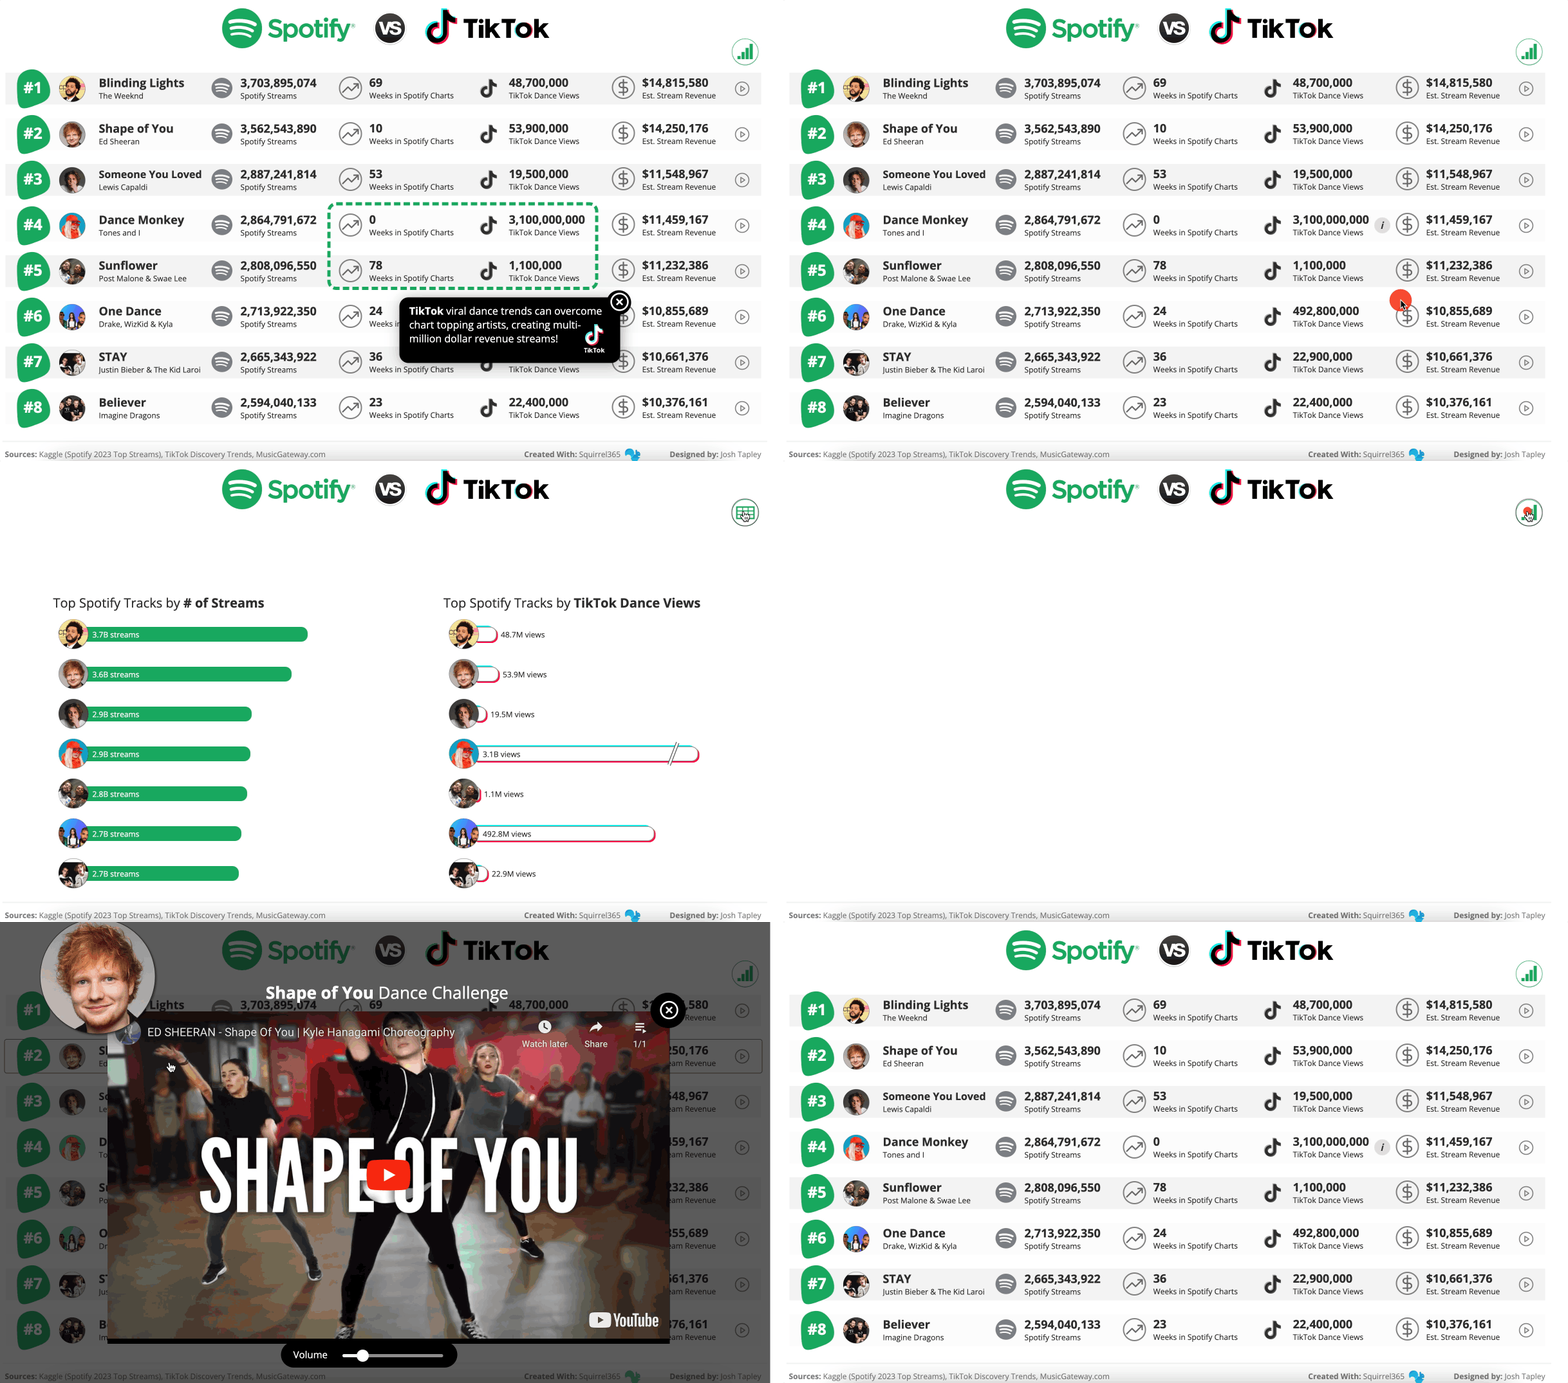
This month’s #DataDNA challenge on LinkedIn used Spotify’s Top 2023 Streams as the data set, so I figured that I’d give it a shot in Squirrel.
I was inspired by a number of visualizations with enhanced data tables, so I figured that I would give that a shot. The repeating container would have been a great time saver here, but I wanted to get fancy with my animation, so I took the harder path.
I was able to use the repeating container to create my rounded bar charts.
Add-ons Used: Animation, YouTube Embed (still figuring out how this one works)
Interactive version: https://bit.ly/3S3S7eM
Source file: https://bit.ly/4008ivh